Diagrams
Visual index of every flowchart and chart used elsewhere in the handover. Each diagram is also embedded inline within the document that owns it (linked below); this page is just a gallery so you can scan them in one place.
D2 source files sit alongside the rendered PNGs and can be re-rendered with
the d2 CLI. The risk heatmap is generated by risk_heatmap.py.
Runbook failure-mode flowcharts
Each runbook embeds its own flowchart at the top. Click through to the runbook for the procedural detail.
Forecast per init

Source: runbook/forecast_per_init.md
· D2: rb_forecast_per_init.d2
Full hindcast re-run

Source: runbook/full_hindcast_rerun.md
· D2: rb_full_hindcast_rerun.d2
Multi-year forecast loop

Source: runbook/multi_year_forecast.md
· D2: rb_multi_year_forecast.d2
QA to prod sync

Source: runbook/qa_to_prod_sync.md
· D2: rb_qa_to_prod_sync.d2
MLflow DB recovery

Source: runbook/mlflow_db_recovery.md
· D2: rb_mlflow_db_recovery.d2
Risk heatmap
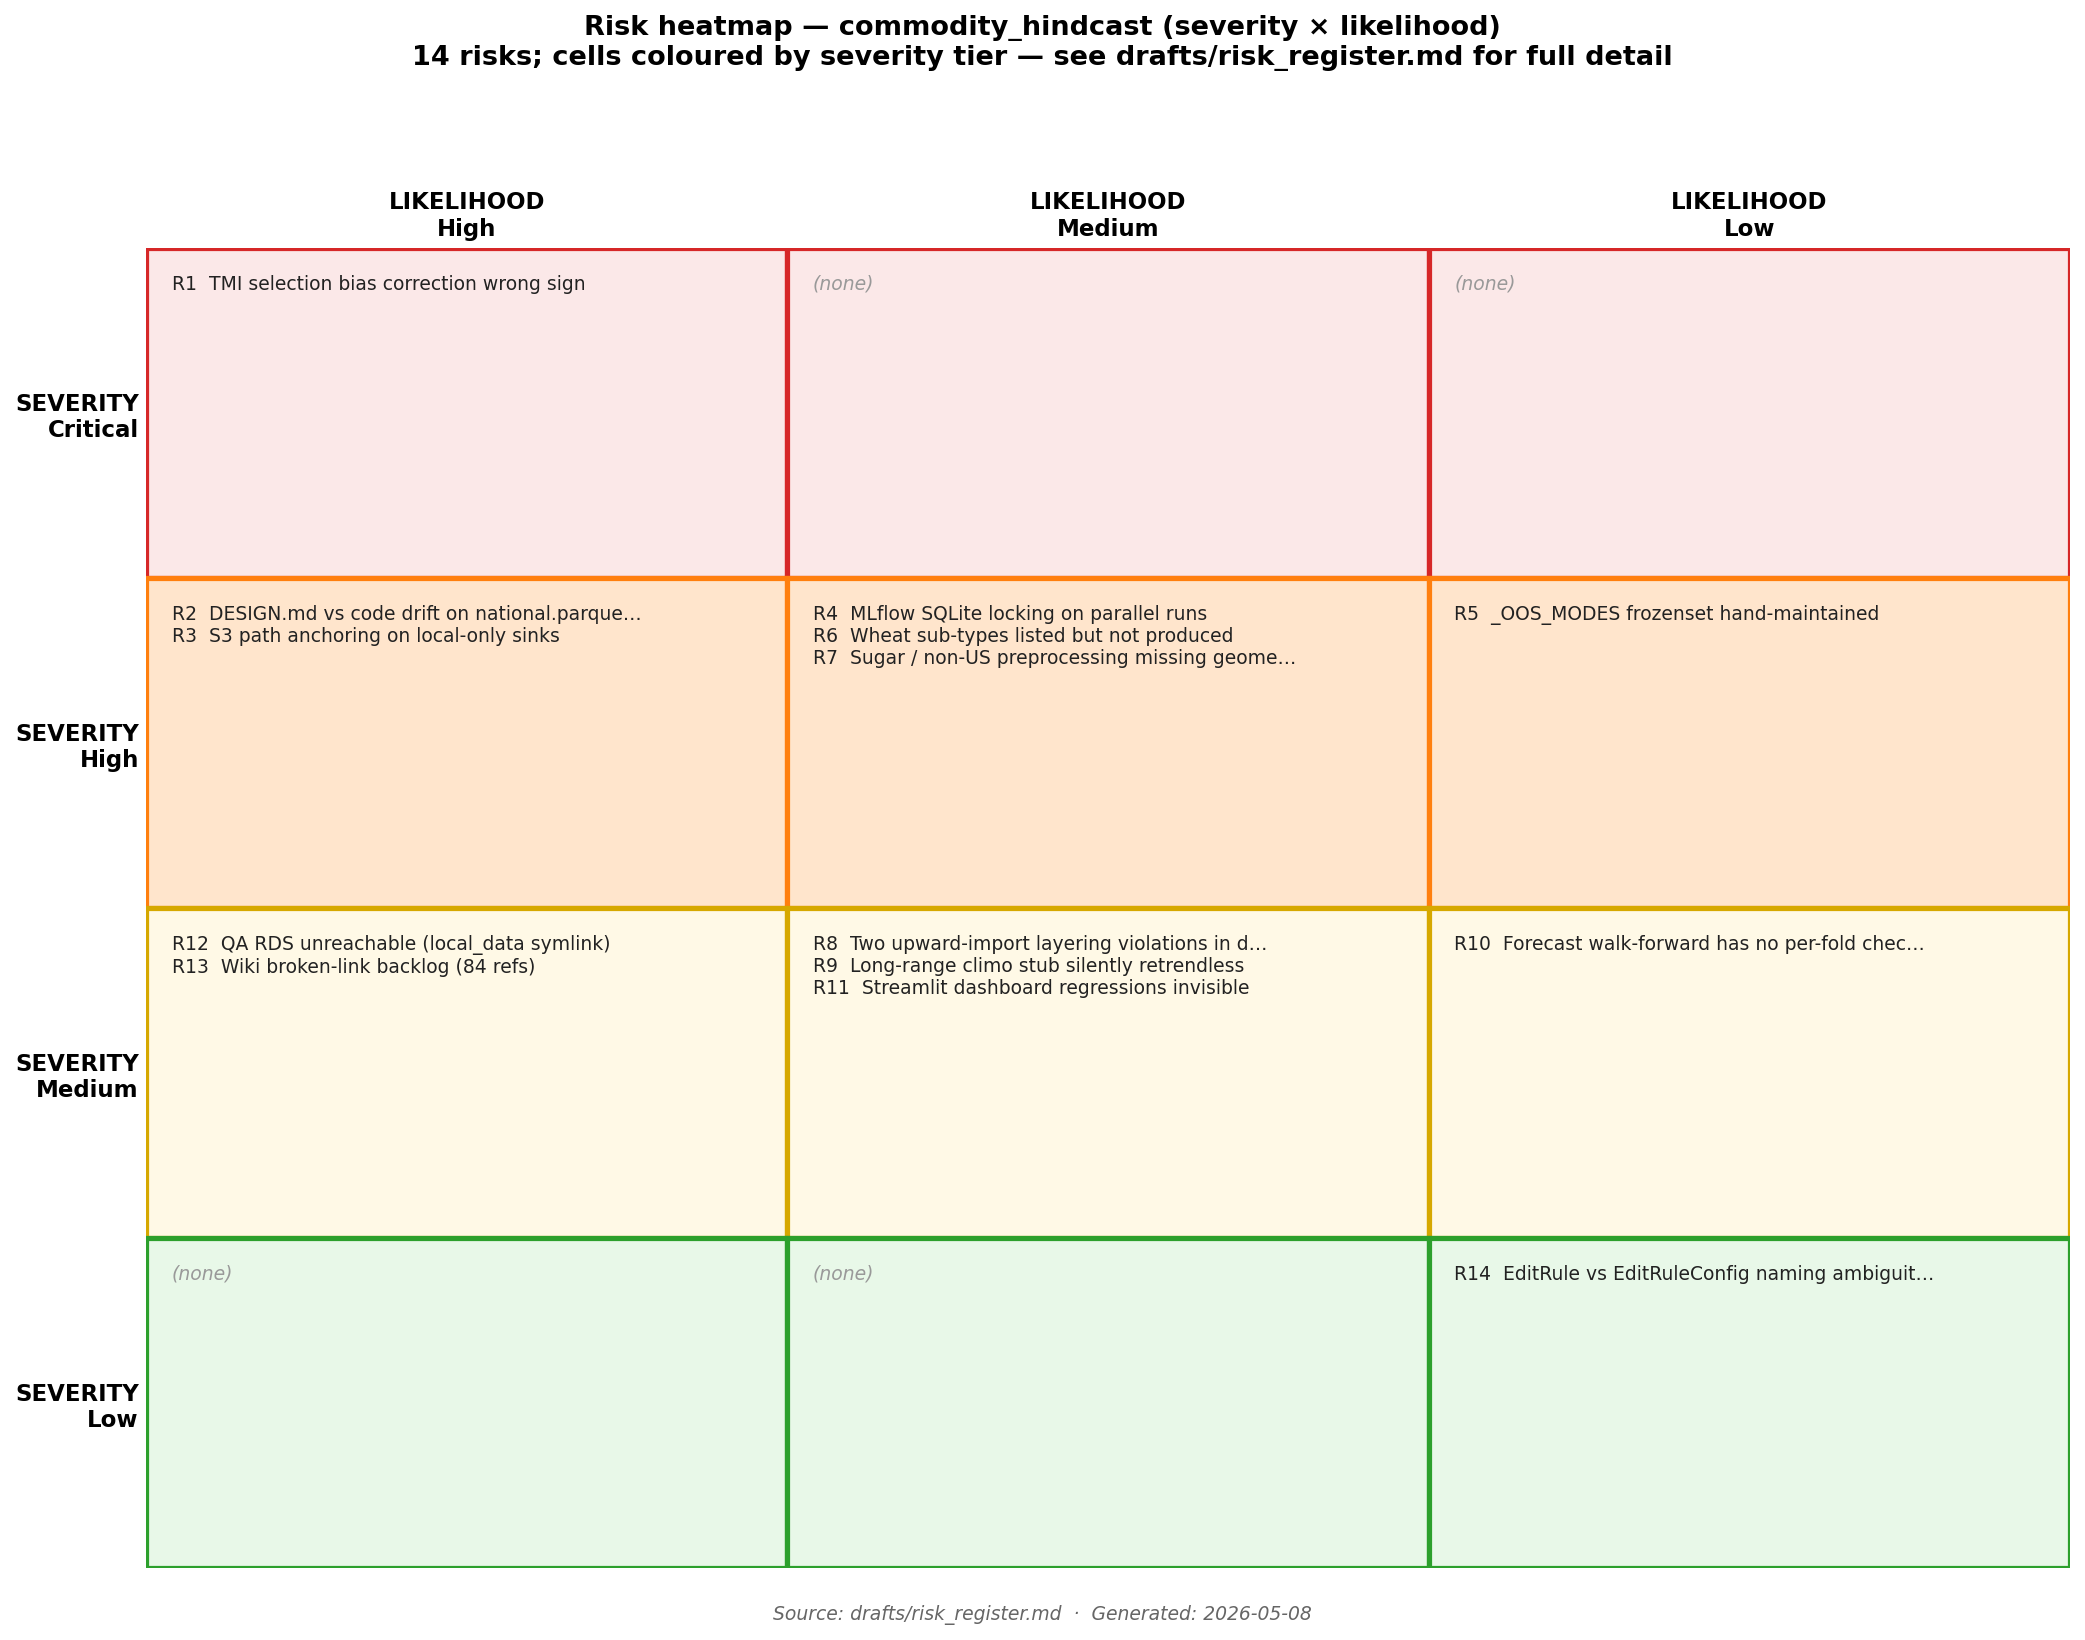
Source: risk_register.md · Generator: risk_heatmap.py
The current PNG renders R1–R14 only; R15–R23 (merged in from the addendum) need a re-render. Tracked as a known followup in the risk register.
Orchestration diagram

Source: IMPLEMENTATION_PLAN.md
· D2: ../orchestration.d2
(Note: this PNG sits at handover/output/orchestration.png, not under
handover/diagrams/output/ — kept where the implementation plan's
relative-path embed expects it.)
Re-rendering
# from the repo root
cd docs/handover/diagrams

# render any single .d2 file
d2 rb_forecast_per_init.d2 output/rb_forecast_per_init.png

# regenerate the risk heatmap
uv run python risk_heatmap.py
The d2 CLI is not installed in CI, so committed PNGs are the source of
truth for rendered diagrams.